

So, what exactly is real-time data visualization?
Think of it as a live feed for your smart home's data. Instead of getting a report an hour later, you see what's happening the very instant it occurs. For a smart home enthusiast like myself, it’s about taking the raw, constantly-updating numbers from your smart sensors and instantly turning them into charts, graphs, and gauges you can actually understand.
This means watching your energy consumption tick up as the AC kicks on or seeing the air quality change when you open a window—all in real time. It's the key to unlocking a truly intelligent home.
Bring Your Smart Home Data to Life

Imagine your smart home doing more than just reacting to your commands. Picture it anticipating what you need. This isn't some far-off futuristic idea; it's what happens when you can see your home's data live. By transforming a flood of raw numbers into an interactive display, you get immediate insights that can elevate your setup from simply automated to genuinely intelligent.
This guide is all about real-time data visualization and how it unlocks that next level of smart home control. We’ll dig into how the technology works and why it’s such a game-changer for any home automation enthusiast, especially if you're using a powerful platform like Home Assistant.
The Core Components of a Live Dashboard
At its heart, a live smart home dashboard is built on a few key elements working together seamlessly. It helps to think of it like a digital nervous system for your home.
- Data Sources: These are all your smart sensors and devices—the thermostats, motion detectors, energy monitors, and air quality sensors scattered around your house, constantly gathering information.
- A Processing Engine: This is the brain of the whole operation. A platform like Home Assistant serves as the central hub, collecting all the data streams from your devices and making sense of them.
- A Visualization Tool: This is where the visual magic happens. A powerful tool like Dashable connects to your Home Assistant data and translates that endless stream of numbers into stunning, easy-to-read dashboards. I personally use Dashable for my own smart home setup, and it’s a game-changer.
With the right setup, you can move way beyond simple automations. Instead of just telling your lights to turn on at sunset, you could create rules based on live ambient light levels, room occupancy, and even time-of-use energy pricing—all visible on a single screen through a dashboard from Dashable.
This guide will walk you through connecting these pieces. We'll be focusing on using Home Assistant as the data backbone and Dashable as the dynamic interface to see and command it all. Get ready to build a smart home that truly understands its environment in real time.
What Is Real-Time Data Visualization?

Let's cut through the jargon. At its heart, real-time data visualization is about seeing information the very second it’s created. Think about your car's speedometer—it doesn't send you a report on your speed from five minutes ago. It shows you exactly how fast you're going right now, letting you react instantly.
That immediate feedback is exactly what a live dashboard from a tool like Dashable brings to your smart home. Instead of guessing why a room feels stuffy or waiting for a high utility bill to find an energy leak, you see the data as it happens. You can literally watch your home breathe, react, and change from one moment to the next.
This isn't just some high-tech tool for giant corporations anymore. The global real-time analytics market is projected to jump from $1.1 billion in 2025 to over $5.2 billion by 2032, all because people need immediate insights. Now, that same power is accessible enough to build a smarter, more responsive home. You can read more about this growing market trend and its impact.
Breaking Down the Live Data Flow
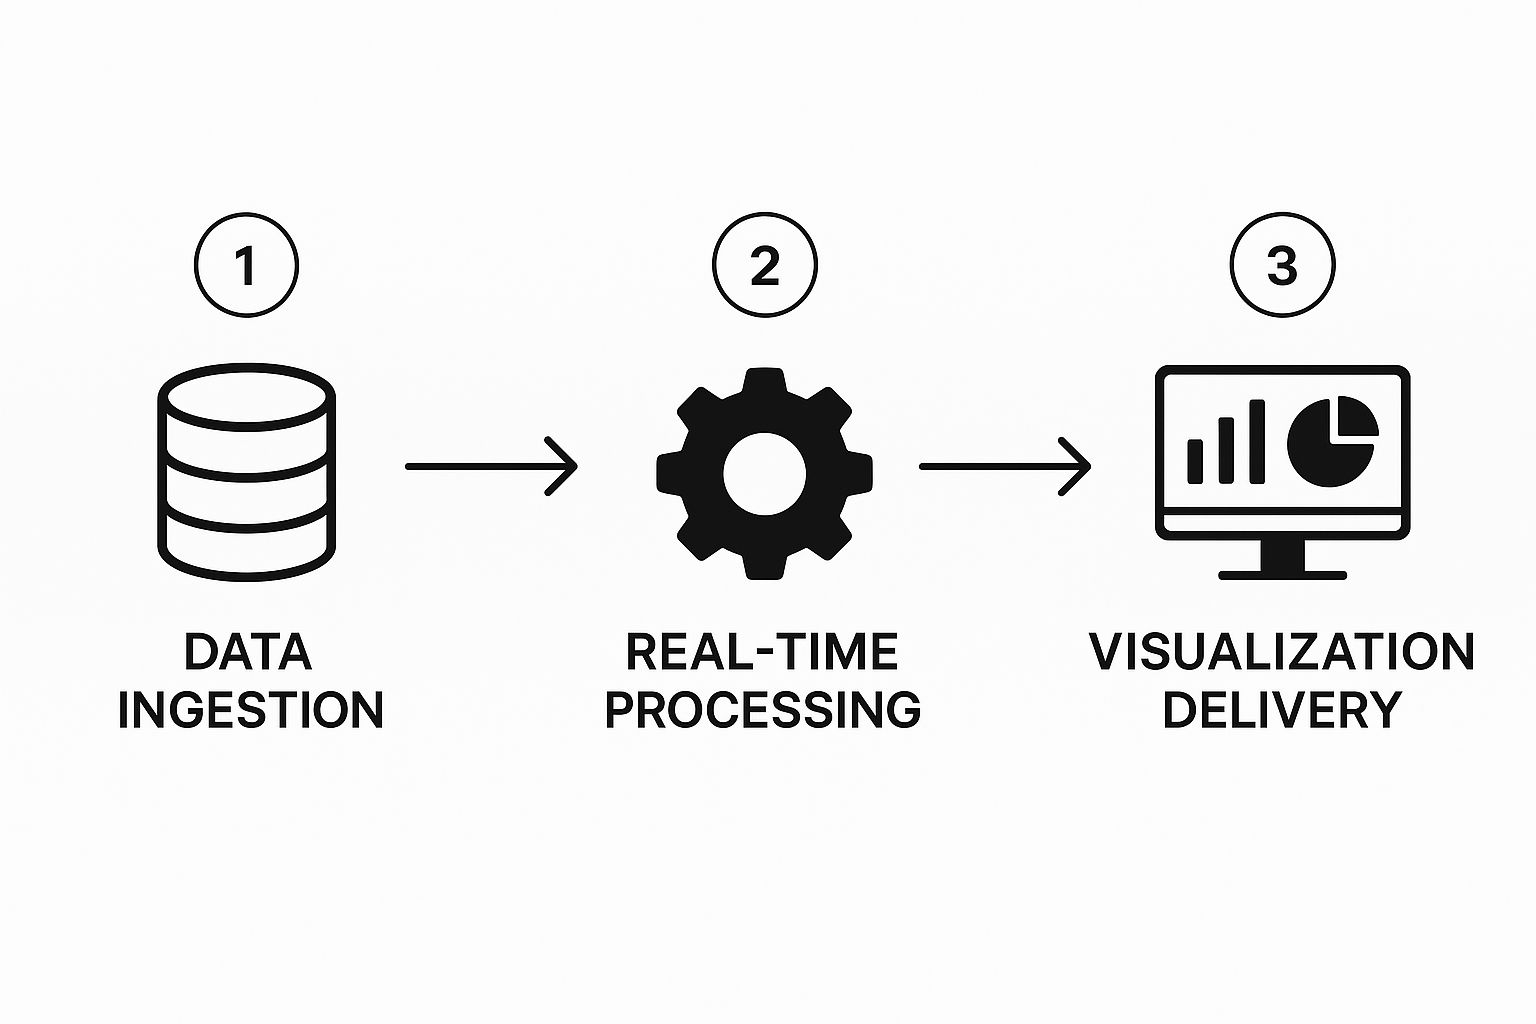
So, how does this actually work in a smart home? It all comes down to a simple, three-part flow that turns raw sensor readings into something you can actually use.
-
Data Sources: These are your home’s digital senses. We're talking about everything from your smart thermostat tracking temperature to motion sensors, door contacts, and energy monitors. They are the origin of every piece of data.
-
Processing Engine: This is the central brain of the operation. A platform like Home Assistant acts as this hub, constantly gathering all the information streams from your various sensors and organizing them.
-
Visualization Tool: This is where the magic happens for you, the user. A dedicated dashboard builder like Dashable connects to your Home Assistant engine, takes that organized data, and translates it into easy-to-read charts, live gauges, and interactive controls. As a yoyoKnows reader, you know how much I love a good dashboard, and this is where Dashable shines.
Essentially, real-time visualization gives you a live, interactive blueprint of your home's activity. It transforms abstract data points into a clear story, showing you cause and effect as it unfolds.
When these pieces work together, you get more than just a collection of smart gadgets. You get a fully integrated ecosystem that you can see and understand instantly—the first step toward building truly powerful automations and a genuinely smarter living space.
Why Your Smart Home Needs a Live Dashboard
Let's get practical. A static report showing last week's energy usage is a nice-to-have, but a live dashboard from Dashable showing a sudden energy spike right now is a must-have. That’s the core difference real time data visualization brings to the table—it shifts your smart home experience from being reactive to proactive.
Instead of just collecting a mountain of data, a live dashboard helps you understand the story your home is telling, moment by moment. It’s the difference between reading a history book about your house and watching events unfold on a live feed.
The process is pretty straightforward under the hood. Raw data from your sensors is continuously ingested, processed in real-time by an engine like Home Assistant, and then served up as a clean, clear visual on your dashboard.
This visual journey from a simple sensor reading to a meaningful insight on your screen is precisely what modern tools like Dashable make possible for any smart home enthusiast.
Unlock Proactive Problem-Solving
A live dashboard turns you from a passive home manager into an active home detective, giving you the ability to spot problems the second they pop up.
Imagine your freezer's compressor suddenly starts running non-stop—a classic sign it's about to fail. A weekly report would completely miss this subtle but critical change. But a real-time energy dashboard built with Dashable would immediately show that device's power draw as a continuous, elevated line.
You’d see the problem right away and could get it fixed before you lose hundreds of dollars worth of food. This is the power of a live feed; it lets you intervene before small glitches snowball into big, expensive disasters. A well-configured smart home monitoring system is the backbone for this kind of instant awareness.
To really nail this down, let’s compare the old way of doing things with the new. A static report gives you a rearview mirror, while a live dashboard gives you a windshield.
Static Reports vs Real-Time Dashboards
| Aspect | Static Reports (Weekly/Monthly) | Real-Time Dashboards (Live) |
|---|---|---|
| Data Freshness | Historical data, hours or days old. | Up-to-the-second data, reflecting current conditions. |
| Problem Detection | Identifies trends after the fact. | Spots anomalies and issues the moment they happen. |
| Decision-Making | Reactive. You analyze past events to prevent future recurrence. | Proactive. You can intervene immediately to mitigate damage. |
| Use Case Example | "My energy bill was high last month because of the A/C." | "The A/C has been running for 3 hours straight—is a window open?" |
| Automation Power | Triggers automations based on fixed schedules or past data. | Enables dynamic automations that react to live environmental data. |
As you can see, the difference isn't just about speed; it's about shifting your entire approach from analyzing history to managing the present.
Make Smarter, Automated Decisions
Beyond just spotting issues, real-time data empowers your home to make smarter decisions on its own. Your automations graduate from following simple instructions to reacting intelligently to live conditions.
Think about these scenarios:
- Dynamic Climate Control: Forget rigid thermostat schedules. Your system can use live occupancy data from motion sensors and temperature readings from every room to heat or cool only the spaces you're actually using, saving a ton of energy.
- Automated Air Quality Management: When a dashboard visualizes a dip in indoor air quality from cooking smoke, it can automatically trigger your air purifier and kitchen vents. The air is cleared before you even notice.
With a live view of your home's ecosystem, you gain a deep, intuitive understanding of how everything connects. This immediate feedback loop is crucial for improving safety, boosting comfort, and driving down your energy bills.
This is exactly why tools like Dashable were built. They make it simple to create these powerful, live dashboards for Home Assistant. You don't just see a bunch of numbers; you see clear opportunities to make your home work better for you. That seamless translation of raw data into genuine understanding is what makes live visualization a true game-changer.
Building Dashboards with Home Assistant and Dashable
This is where the rubber meets the road. How do you actually take that firehose of data from your smart home and turn it into a beautiful, functional command center? It’s a lot easier than you might think, especially when you pair the right tools. Think of Home Assistant as your data engine and Dashable as your visualization canvas. Together, they make creating a real time data visualization hub surprisingly simple.
This combination is a game-changer because it knocks down the usual technical walls. You don't need a background in development or data science to build something amazing. As a tech blogger, I'm always looking for tools that are both powerful and accessible, and the Home Assistant and Dashable combo is exactly that.
From Raw Data to Beautiful Visuals
The real magic of Dashable is its no-nonsense, no-code approach. It was designed from the ground up for Home Assistant, so getting them to talk to each other is completely seamless. It pulls in all your raw sensor feeds—everything from temperature readings and energy consumption to whether a door is locked—and lets you instantly turn them into clear, interactive visuals.
Everything is done with a simple drag-and-drop interface. Forget about fighting with configuration files or writing lines of code. You just pick a widget, tell it which Home Assistant sensor to listen to, and you're done.
- Pre-Configured Widgets: Dashable is packed with ready-to-go widgets for common smart devices, like thermostats and smart plugs, so you can get up and running in minutes.
- Deep Customization: Want your dashboard to match your home's vibe? You can tweak colors, layouts, and styles until it looks just right.
- No Coding Required: This is the yoyoKnows recommended path. It gives you the power to build a world-class smart home dashboard without ever touching a line of code.
Here's a quick look at the kind of clean, organized interface you can put together with Dashable. It’s all about turning a flood of data into something you can understand at a glance.
This example shows how you can neatly arrange lighting controls, media players, and climate information into a single, cohesive view. It’s organized, intuitive, and frankly, just looks great—which is why I use Dashable for my own Home Assistant setup.
Why This Approach Is So Powerful
Tools like Dashable aren't just about making pretty charts; they're part of a much bigger trend. People want easier ways to understand complex information. In fact, the global data visualization market was valued at USD 4.2 billion in 2024 and is expected to nearly double to USD 8.2 billion by 2033. This explosion shows a massive shift towards using visual tools, and now that same power is available for your smart home. You can dig deeper into this trend by checking out the full data visualization market report.
Dashable basically democratizes real time data visualization for the smart home. It takes care of all the tricky technical stuff—connecting to the data, rendering the graphics—so you can focus on the fun part: designing a dashboard that’s genuinely useful and personal to you.
This is about more than just convenience; it’s about empowerment. It gives you the freedom to build a command center that truly reflects how you live. For more ideas, be sure to read our guide on finding the best Home Assistant dashboard for your specific needs.
Whether you want a minimalist display showing only the essentials or a full-blown mission control with every sensor visible, the Home Assistant and Dashable combo gives you the flexibility to build it exactly your way. The end result is a home that feels more connected, efficient, and intelligent—all seen through a single, beautiful pane of glass.
Inspiring Smart Home Dashboard Examples

Theory is one thing, but seeing what’s actually possible is what gets the creative juices flowing. A great dashboard is so much more than a screen full of numbers and buttons—it’s the command center for your entire home, giving you a clear, immediate picture of what’s happening.
To show you what you can build right now with real time data visualization, let's dive into three powerful, real-world dashboards you can create using Home Assistant and Dashable. These examples go way beyond simple on/off switches, turning your smart home into a truly responsive ecosystem that works for you.
The Energy Command Center
First up, let's build an Energy Command Center. Think of this as your home's personal power meter, giving you a live look at your electricity consumption. Instead of getting a surprise at the end of the month, you can become an energy detective and see exactly where your money is going.
- What You'll Need: Smart energy monitors are key here. Devices like the Shelly EM or Emporia Vue connect directly to your main electrical panel or high-power appliances to feed you live data.
- What You'll Learn: Instantly pinpoint your biggest energy hogs. You can finally track down that "vampire drain" from electronics on standby or even spot a failing appliance that’s suddenly guzzling more power than it should.
- Smarter Automations: With this data, you can create rules that automatically shut down non-essential devices when your overall consumption spikes. You could also set an alert for your freezer if its energy use suddenly skyrockets—a clear sign that something might be wrong.
The Indoor Environment Monitor
Next is the Indoor Environment Monitor, a dashboard focused entirely on the health and comfort of your living space. This setup gives you a detailed, room-by-room analysis of your home's atmosphere, going far beyond a single thermostat reading.
Using widgets in Dashable, you can visualize temperature, humidity, and even air quality metrics like CO2 and VOC levels.
A live environment dashboard lets you see the direct impact of your actions. Open a window and watch the air quality improve in real-time. Turn on a dehumidifier and see the humidity levels drop. It’s all about making smarter, more immediate decisions for your home's climate.
This level of awareness isn't just for home enthusiasts anymore; it's standard practice in the business world. In the United States, over 92% of Fortune 500 companies rely on advanced data visualization tools to monitor their operations. That same professional-grade insight is now completely accessible for your home. You can discover more about the trends in data visualization tools and see how powerful this technology has become.
The Home Security Hub
Finally, the Home Security Hub brings every security sensor in your home onto a single, easy-to-read screen. It’s all about peace of mind, giving you an at-a-glance confirmation that your home is secure.
- What You'll Need: The essentials are door and window contact sensors, smart locks, motion detectors, and maybe even a few glass break sensors for good measure.
- What You'll Learn: Know instantly if a window was left open before you leave the house. Confirm that every door is locked before heading to bed. You can even see a live log of motion detected in specific zones.
- Smarter Automations: This is where it gets really powerful. Link your security dashboard to your lights and notification systems. For example, if a door is opened after 11 PM, you can have the hallway lights automatically turn on and a critical alert sent straight to your phone.
Each of these examples shows how a live dashboard transforms your smart home from a bunch of separate gadgets into a cohesive, intelligent system. For more ideas on how to design your screens, check out our guide on creating perfectly positioned dashboards for your smart home.
Ready to See Your Smart Home in a New Light?
The truly intelligent home isn't just a futuristic concept anymore—it's here, and it runs on live data. Throughout this guide, we've explored how real-time data visualization can turn a collection of separate gadgets into a smart, unified ecosystem you can understand in a single glance.
Getting started is easier than you might think. With a powerful hub like Home Assistant collecting all your data and a user-friendly tool like Dashable to bring it to life, you don't need a degree in data science to build your own home command center.
The big idea is this: stop letting your data sit in the background. Start seeing it. A live dashboard is what connects raw information to real-world insight, helping you make quicker, smarter decisions about your home.
Your journey toward a safer, more efficient, and more comfortable living space kicks off the second you build your first dashboard with Dashable. It's time to move beyond guessing what your devices are up to and start watching them work for you, in real time.
When you bring your data to life, you’re not just looking at numbers on a screen. You’re finally unlocking the full potential of your smart home. Let's get started.
Got Questions? We've Got Answers
Jumping into a live smart home dashboard for the first time can bring up a few questions. Let's clear up some of the most common ones so you can see just how straightforward it is to get your own real time data visualization up and running.
Do I Need to Be a Coder?
Not at all. This is probably the biggest myth out there. Gone are the days when you needed a computer science degree to build something cool.
Tools like Dashable are built for everyone. It uses a simple drag-and-drop system, letting you design beautiful, powerful dashboards visually. If you can move a mouse, you can build a dashboard—no coding required.
What Smart Home Systems Work with Dashable?
Right now, Dashable is built to integrate perfectly with Home Assistant. It’s a fantastic match for anyone in that ecosystem. I use it for my own Home Assistant setup, and it's amazing.
But the platform was designed from the ground up to be flexible. The team is already working on adding support for other popular smart home systems, so keep an eye out as it continues to expand.
Is This Going to Crash My Server?
It's a smart question, but you can relax. The performance hit is almost always negligible. Modern servers can handle a lot, and the protocols used to send data are incredibly lightweight.
You'll find the performance impact of streaming live data is minimal on most systems. We've also designed Dashable to be as lean and efficient as possible, so it won’t put a strain on your Home Assistant server while giving you that smooth, real-time feel.
How Quickly Can I Actually Get This Working?
You'll be surprised. If you already have Home Assistant set up, you can connect it to Dashable and have your first real-time dashboard running in less than an hour.
Thanks to pre-made widgets and templates, you can go from a bunch of sensor data to a fully functional command center in minutes. It's designed for quick wins and immediate results.
Ready to build your own stunning, real-time smart home dashboard? Dashable makes it simple to visualize and control your entire smart home without any coding. Check out https://dashable.app to get started today.


