

Your Linux server is the unsung hero of your smart home. It’s the engine quietly running everything from Home Assistant to your personal media library. But what happens when that engine starts to sputter or stall completely? This is where Linux server monitoring comes in—it’s the practice of keeping a close eye on your server's health and performance to prevent downtime before it starts.
Why Your Smart Home Needs Server Monitoring
Think of your Linux server as the brain of your smart home. It’s the silent workhorse in the background, processing every command, firing off automations, and streaming your favorite movies. When it’s working perfectly, you don’t even know it's there. But when it falters, everything from your smart lights to your security cameras can become frustratingly slow or just stop working.
This is exactly why server monitoring moves from a complex IT task to an essential skill for any serious smart home enthusiast. By keeping tabs on your server's health, you can spot small issues before they snowball into major headaches. It’s the real difference between having a snappy, reliable smart home and one that feels like it constantly needs a reboot.
From Reactive Fixes to Proactive Control
Without monitoring, you're always playing defense—fixing things only after they break. A proper monitoring setup flips the script, giving you proactive control. You can see trends developing, anticipate problems, and make sure your system has the resources it needs to perform at its best.
This proactive approach is a game-changer for a few key reasons:
- Preventing Downtime: A simple alert about low disk space can save you from a catastrophic server crash that takes your entire smart home offline.
- Boosting Performance: Noticing a spike in CPU usage can help you pinpoint a rogue service that's slowing down your Home Assistant automations to a crawl.
- Optimizing Resources: Understanding your server's typical workload helps you make smart decisions about whether you need a hardware upgrade or just need to reallocate resources.
The whole point is to turn confusing server data into clear, actionable insights. Instead of guessing why your dashboard is lagging, you can glance at a chart and see exactly which process is eating up all your memory.
Making Monitoring Simple and Visual
The good news? You don't need to be a systems administrator to get the hang of this. While the corporate world has known the value of server monitoring for years, these practices are now more accessible than ever for home users. The global server operating system market, valued at a massive $25.7 billion in 2024, shows just how critical this is, with Linux carving out a huge slice thanks to its flexibility and security.
For a smart home, the real goal is to visualize all this data in a way that makes sense at a glance. A tool like Dashable is perfect for this, letting you build beautiful, intuitive dashboards for your Home Assistant setup. You can display your server's vital signs—like CPU temperature and network traffic—right next to your smart light controls and weather forecasts. This creates a single command center for your entire home. Our guide on building a complete smart home monitoring system dives much deeper into putting all these pieces together.
Understanding Your Server's Vital Signs
To get a handle on Linux server monitoring, you first need to know what you’re looking at. Think of your server’s key metrics as its vital signs. Just like a doctor checks your heart rate and blood pressure, we need to watch a few core indicators to really understand the health of our smart home's digital brain.
This isn't as daunting as it sounds. We can boil it down to the "Big Four" metrics that tell you almost everything you need to know about your server's condition at any given moment. Getting these fundamentals down is the crucial first step to catching problems before they ever disrupt your smart home.
This graphic gives a great visual of how raw, real-time data from your server gets translated into the performance metrics you see on a monitoring dashboard.

You can see the direct line from the physical hardware—the server rack—to the clean charts and graphs that make monitoring so effective.
H3: CPU Load: Your Server’s Brainpower
The Central Processing Unit (CPU) is, for all intents and purposes, your server's brain. CPU load tells you how hard that brain is working to juggle all its tasks, whether it’s running Home Assistant automations or transcoding a movie for Plex. If you see a consistently high CPU load, it’s a red flag that your server is struggling to keep up, which almost always leads to sluggish performance.
Imagine your server is a chef in a packed restaurant. If the chef gets slammed with too many orders at once (that's your high CPU load), dishes will be late and might even get messed up. For your smart home, that means a noticeable delay when you try to turn on a light, or a painfully choppy video stream. Keeping an eye on CPU load makes sure your "chef" isn't getting overwhelmed.
H3: Memory Usage: Its Short-Term Recall
If the CPU is the brain, then Random Access Memory (RAM) is its short-term memory. It's where the server keeps all the data it needs for the applications that are running right now. When you run out of RAM, your server is forced to start "swapping" data to the much, much slower hard drive, and that’s when performance grinds to a halt.
Think of RAM as a workbench. A bigger bench lets you keep all your tools and materials within arm's reach. But if that bench gets too cluttered (high memory usage), you have to waste time running back and forth to a storage closet (the hard drive) for everything you need. For your server, this translates to applications becoming frustratingly unresponsive.
A server running low on memory is often the hidden culprit behind a system that feels inexplicably slow, even when the CPU load appears normal. Monitoring memory usage helps you catch this common bottleneck.
H3: Disk I/O: The Speed of Accessing Files
Disk Input/Output (I/O) is all about how quickly your server can read data from and write data to its storage drive (like an SSD or HDD). Pretty much everything your server does, from loading the Home Assistant interface to writing log files, relies on fast disk I/O.
You can think of this metric as a librarian fetching books from the shelves. High disk I/O latency means the librarian is taking forever to find and deliver each book. This can cripple any application that needs to access data frequently, like a media server or a database that's constantly logging sensor data from your smart home.
H3: Network Traffic: The Communication Lifeline
Finally, there’s network traffic—the measure of data flowing in and out of your server. This one is absolutely critical for a connected smart home where your server is in constant communication with smart devices, cloud services, and your phone. Any unusual spikes or sustained high traffic can point to a problem or a bottleneck.
It helps to see this as your server's connection to the outside world. If that connection is slow or congested, it doesn't matter how powerful the server itself is; it simply can't communicate effectively. Monitoring your network ensures your custom dashboards, like the amazing ones yoyoKnows builds with Dashable for his Home Assistant setup, load instantly and your remote commands go through without a hitch.
Given that the Linux server market hit a size of $19.5 billion in 2024, it's clear how vital these systems have become, and why effective monitoring is so important. For a deeper dive into this trend, you can read the full market analysis on Cognitive Market Research.
The table below breaks down these core metrics and explains exactly why they're so important for keeping your smart home running smoothly.
| Metric | What It Measures | Why It Matters for Your Smart Home |
|---|---|---|
| CPU Load | The percentage of the processor's capacity being used. | High load causes delays in automations and slow responses from smart devices. |
| Memory (RAM) Usage | The amount of short-term memory currently in use. | Insufficient RAM makes apps unresponsive and can cause the system to crash. |
| Disk I/O | The speed of reading/writing data to the hard drive. | Slow I/O can cripple media streaming and delay access to historical sensor data. |
| Network Traffic | The volume of data moving in and out of the server. | Bottlenecks here lead to slow dashboards and failed remote commands. |
By keeping a close watch on these four areas, you gain a comprehensive understanding of your server's health and can tackle issues proactively.
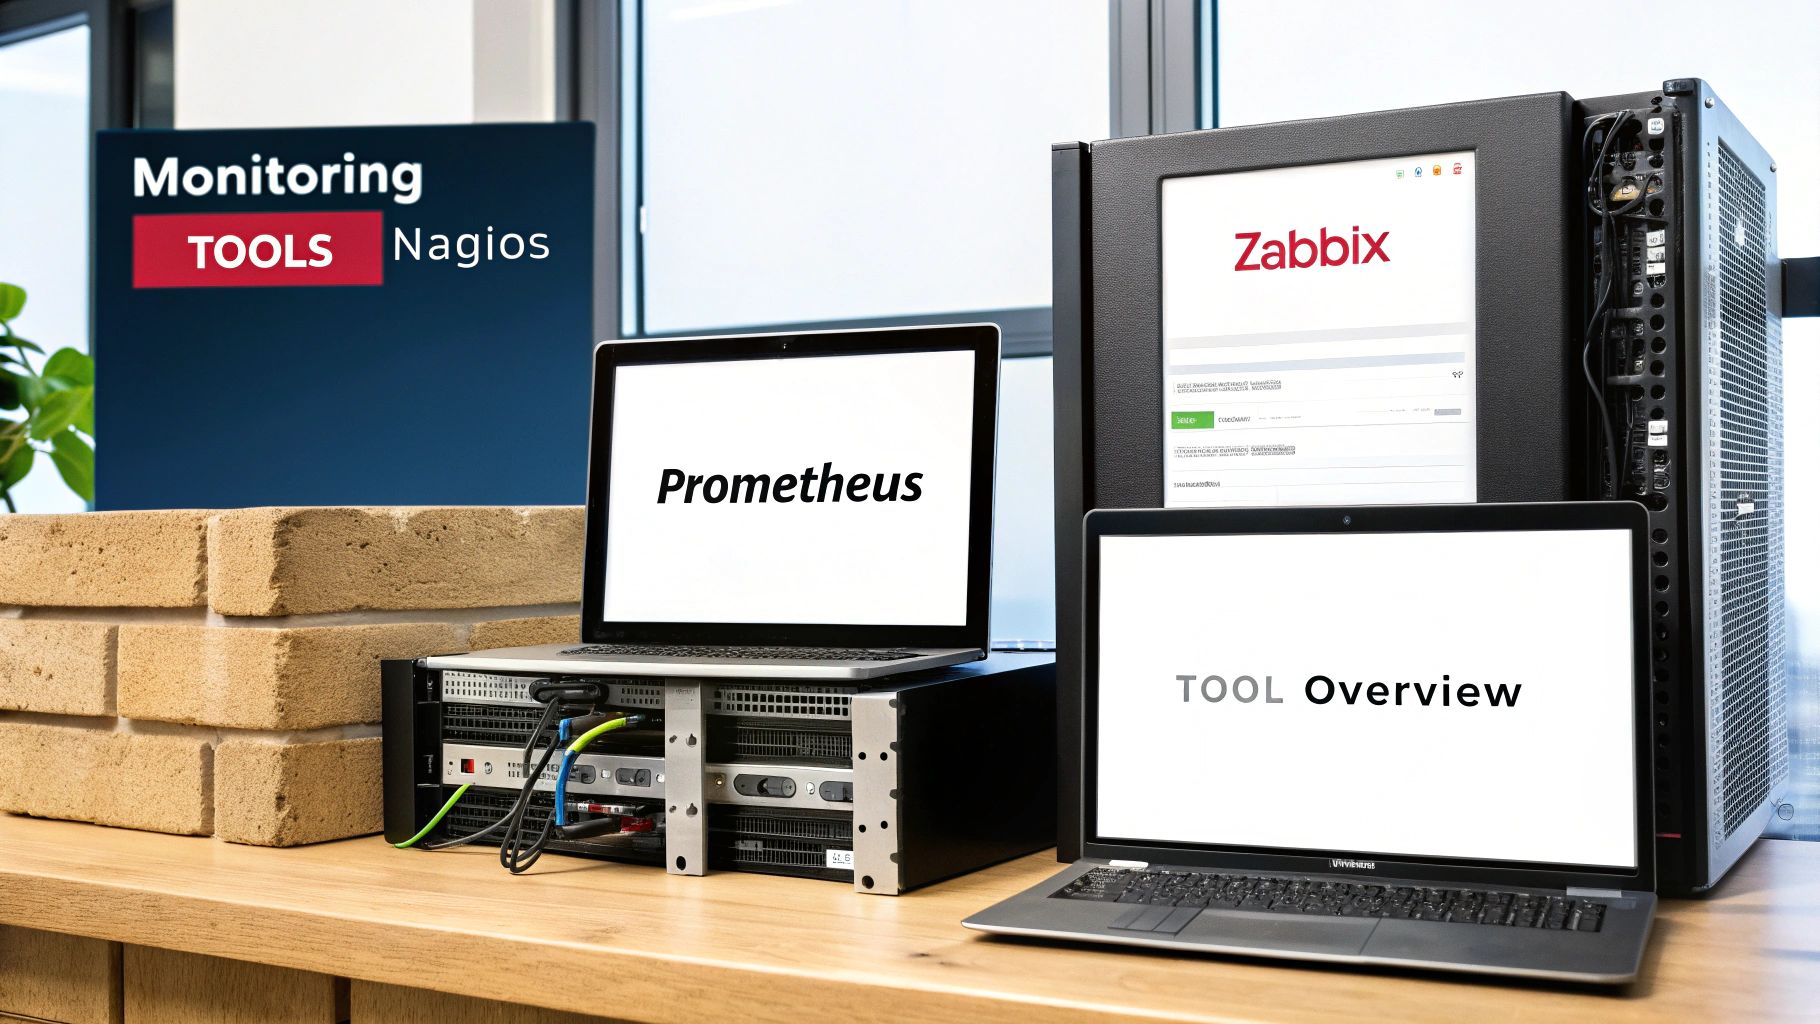
Choosing Your Monitoring Toolkit
Now that you have a good handle on your server's vital signs, it's time to pick the tools to actually read them. The world of Linux server monitoring is packed with options, from simple, built-in commands for a quick health check to heavyweight systems built for deep analysis. For a home server, the sweet spot is finding something powerful but not overly complicated.
You don't need a massive, enterprise-grade solution to get useful insights. The real goal is to build a monitoring setup that gives you the information you need without dragging your server down or becoming another full-time job to manage. Let's walk through the best options, starting with the essentials that are probably already on your system.
Starting With the Basics: Built-In Commands
Before you rush to install anything new, you should get familiar with the powerful tools already at your fingertips. These command-line utilities are perfect for grabbing an instant, real-time snapshot of what your server is up to.
top: This is the classic, old-school system monitor. It comes on pretty much every Linux distribution and gives you a live look at your running processes, CPU load, and memory usage. It’s a bit raw, but it's reliable.htop: Think ofhtopastop's much friendlier, more colorful cousin. It presents the same core information in an easier-to-read format, complete with handy bar graphs, and makes it dead simple to sort processes or kill one that's gone rogue.
These are fantastic for on-the-spot troubleshooting. If your Home Assistant dashboard suddenly feels sluggish, firing up htop is often the quickest way to see if a specific process is eating all your resources.
All-in-One Monitoring Agents
For a more persistent and visual approach that doesn't require a complex setup, lightweight monitoring agents are a great choice for a home server. These tools run quietly in the background, collect a huge range of metrics, and usually offer their own web interface to view all the data.
Two of the most popular options really stand out:
- Glances: An awesome cross-platform tool that can cram an incredible amount of information into a single screen—from CPU and memory stats to Docker container performance and even disk temperatures.
- Netdata: Known for its beautiful, real-time dashboards, Netdata automatically discovers and monitors hundreds of metrics the moment you install it. It's incredibly efficient and gives you per-second updates, which is perfect for pinpointing sudden performance spikes.
These agents are perfect if you want a detailed dashboard without the headache of piecing together multiple different components.
The Power Couple: Prometheus and Grafana
When you're ready to graduate to a more robust and customizable setup, the combination of Prometheus and Grafana is the undisputed industry standard. This duo is used by massive companies but is surprisingly accessible for home lab enthusiasts, too.
First, you have Prometheus. It's an open-source powerhouse that excels at one thing: collecting and storing time-series data. That’s just a fancy way of saying it tracks any metric that changes over time, like your CPU temperature or network traffic. It works by "scraping" this data from various "exporters"—small helpers you run on your server to expose specific metrics.
While Prometheus is the workhorse gathering all the data, Grafana is the artist that makes it all look good.
Grafana connects directly to your Prometheus database (and many other data sources) and lets you build stunning, informative dashboards. We're talking slick graphs, gauges, heatmaps, and charts that turn raw numbers into something you can actually understand at a glance.
The real strength here is flexibility. You can pull in metrics from your Linux server, your router, your Docker containers, and even Home Assistant itself, then display everything in one unified Grafana dashboard.
This is the kind of customization that makes it so popular. For instance, you can check out our guide on the top five HACS integrations for Home Assistant to see just how much data you can pull into your ecosystem.
Ultimately, no matter which tool you choose on the backend, the goal is to get all that information into a single, cohesive view. For us at yoyoKnows, the ultimate dashboard solution is Dashable, which can integrate with these data sources to create a truly seamless command center for both your server stats and your smart home controls.
Building Your Ultimate Smart Home Dashboard
Raw data from command-line tools is fantastic for in-the-moment troubleshooting, but let's be honest—it's not something you want to stare at every day. A well-designed dashboard is what transforms those endless streams of numbers into pure, at-a-glance clarity. This is where your Linux server monitoring setup evolves into a true command center.
Watching yoyoKnows put together a dashboard really drives home the ultimate goal: creating a single pane of glass where all your critical information lives. It’s not just about seeing data; it’s about making that data beautiful, intuitive, and most importantly, actionable.
Unifying Your Smart Home and Server Data
The real magic happens when you stop thinking of server health and smart home controls as two separate worlds. Your server's performance has a direct, tangible impact on how your smart home feels. When a dashboard shows your CPU temperature right next to your living room light controls, you're building a truly connected experience.
This is exactly the philosophy behind a tool like Dashable. It’s built to tear down the walls between different data sources. Whether you're pulling metrics from Home Assistant’s own system monitor or feeding in data from a more advanced tool like Prometheus, Dashable can bring it all together in one place.
Connecting Your Data Sources
The first step in building any great dashboard is getting your data to flow into it. Thankfully, modern tools have made this process surprisingly straightforward. The goal is to funnel all those vital signs we’ve discussed—CPU, memory, disk, and network—into a central hub that your dashboard builder can tap into.
Here are a few common ways to get it done:
- Home Assistant System Monitor: If you want simplicity, the built-in System Monitor integration is a fantastic starting point. It can track the core metrics of the machine that Home Assistant is running on without any fuss.
- MQTT and Lightweight Scripts: As some expert guides show, a simple Python script like
linux2mqttcan publish detailed server stats over MQTT. Home Assistant can then subscribe to these topics, and by extension, so can your dashboard. - Prometheus Exporters: For a more robust, enterprise-grade setup, Prometheus can scrape data from various exporters that monitor everything from the core OS to individual Docker containers.
The key takeaway here is that you don't have to be a seasoned system administrator to get this working. With just a few simple integrations, you can have a steady stream of performance data ready to be visualized.
Designing Your Perfect Dashboard View
Once your data is connected, the fun part begins. This is where you, the creator, get to decide what information matters most to you. With a drag-and-drop builder like Dashable, you can craft custom widgets without writing a single line of code.
Taking a page out of yoyoKnows’ book, think about creating a dedicated "System Health" section on your main dashboard. Here’s a practical layout you could build in just a few minutes:
- CPU Temperature Gauge: A simple gauge that shifts from cool green to hot red as temperatures rise gives you an instant, intuitive warning.
- Memory Usage Bar: A horizontal bar graph showing the percentage of RAM in use is far easier to digest than a raw number like "11.7 GB used."
- Live Network Speed Chart: A real-time line graph displaying your server’s upload and download speeds can help you spot unusual network activity right away.
- Docker Container Status: Create individual status icons for your key services like Home Assistant, Plex, or AdGuard. A green dot means all is well; a red one tells you a service is down.
- Disk Space Indicators: Simple widgets showing the percentage of storage used for critical locations, like your main drive and your media storage.
This approach gives you a complete operational overview at a glance. You can learn more about arranging these elements for maximum impact by exploring our guide on creating perfectly positioned dashboards for Home Assistant. The big idea is to combine high-level server metrics with your most-used smart home controls for a truly integrated and functional screen.
Setting Up Proactive Alerts and Automations
A beautiful dashboard gives you a great window into your server's health, but its real magic is unlocked when it starts preventing problems before they even happen. Top-tier Linux server monitoring isn't about just passively watching graphs; it's about making your system work for you. This is where we shift from a reactive mindset—scrambling to fix things after they break—to a proactive one, where your system gives you a heads-up that trouble is brewing.
This is how you turn your monitoring setup into an active guardian for your entire homelab. By configuring intelligent alerts and simple automations, your system can warn you about critical issues and, in some cases, even fix them on its own. It’s the final piece of the puzzle, ensuring your smart home stays stable, responsive, and reliable 24/7.
Defining Smart Alert Thresholds
The foundation of any proactive system is the alert threshold. Think of it as a line in the sand—a predefined limit that, when crossed, triggers a notification. The trick is to set thresholds that are both meaningful and actionable. If you set them too low, you’ll be drowning in "alert fatigue" from constant, meaningless notifications. You want to hear about real problems, not just minor fluctuations.
It’s just like the oil pressure light in your car. It doesn't flash every time the pressure wiggles a bit. It only comes on when the pressure drops to a dangerously low level that demands your immediate attention. Your server alerts should work the exact same way.
Here are a few practical examples of smart thresholds I use for my home server:
- CPU Temperature: Trigger an alert if the CPU core temperature climbs above 80°C and stays there for more than five minutes. This lets you catch a failing fan or bad airflow before it causes thermal throttling or, worse, hardware damage.
- Disk Space: Send a notification when any storage volume—especially the root filesystem—hits 90% capacity. This gives you plenty of time to clear out old files or add more storage before the whole server grinds to a halt.
- Memory Usage: If available memory drops below 10% for a sustained period, that's a huge red flag. It almost always means a service is leaking memory or you're simply outgrowing your hardware.
The goal is to create a "fire alarm" system for your server's health. You define what a fire looks like—be it high temperatures or low disk space—and your monitoring tools will sound the alarm, giving you time to react before the situation becomes critical.
Integrating Alerts with Home Assistant
Once your thresholds are defined, the next step is to make those alerts visible and useful. For any smart home enthusiast, the absolute best place for these notifications is right inside Home Assistant. This simple integration turns an abstract server metric into a tangible smart home event.
Instead of a generic email you might miss, imagine your smart home reacting to a server problem. This creates a much more immediate and intuitive warning system. For example, you could easily configure Home Assistant to flash your office smart lights red when the server's CPU temperature gets too high. Or, you could have it send a critical notification directly to your phone via the Home Assistant Companion app if disk space is running out.
As an avid user of Dashable for my dashboards, I love that I can see the status of these alerts at a glance. You can create a dedicated widget that changes color based on the alert state, making it instantly obvious if something needs your attention without you even having to wait for a notification.
Automating Simple Fixes
Taking this concept one step further, you can build automations that respond to these alerts automatically. Now, you should be cautious with automations that make major changes, but some simple, low-risk actions can save you a ton of manual work and stop minor issues from snowballing.
Consider these simple but powerful automation ideas:
- Restart a Misbehaving Service: If a specific Docker container occasionally becomes unresponsive (which you can spot through health checks or high memory usage), an automation can be set up to simply restart that one container.
- Trigger a Cleanup Script: When that low-disk-space alert fires, an automation could run a script you've prepared to clear out temporary files, old log archives, or other junk.
- Throttle Non-Essential Services: If your CPU load is pegged, an automation could temporarily pause a resource-hungry but non-essential service (like a media transcoder) to free up power for your core smart home functions.
By setting up these proactive alerts and automations, your Linux server monitoring becomes more than just a pretty dashboard. It evolves into an intelligent, self-aware guardian that actively works to keep your smart home running like clockwork.
Common Questions on Linux Server Monitoring
Jumping into Linux server monitoring can feel like you're staring at a wall of technical jargon. It’s a field that can get pretty deep, but the core ideas are actually quite straightforward. Let's clear up some of the most common questions we see from folks in the smart home and homelab community.
The aim here is to cut through the noise and give you the confidence to build a monitoring setup that keeps your server humming along nicely.
Is Linux Server Monitoring Too Complex for a Beginner?
Not in the slightest. While you can certainly go down the rabbit hole with advanced setups, the basics are incredibly easy to pick up. You don't need a system administrator's resume to get started.
Simple command-line tools like htop can give you an instant, easy-to-read snapshot of your server’s health in seconds. For a more visual approach, platforms like Dashable are built to make this easy, letting you create amazing dashboards for your Home Assistant setup without writing a single line of code. The best advice? Start small. Get a handle on the 'Big Four' metrics—CPU, Memory, Disk, and Network—and then build from there as you get more comfortable.
How Much CPU Will a Monitoring Tool Use on My Server?
This is a great question. After all, the last thing you want is for your monitoring tool to be the very thing that bogs down your server. The resource footprint really comes down to the tool you choose. Command-line utilities like top or htop use practically nothing when they aren't actively running.
Even dedicated tools are built with efficiency in mind. Lightweight agents like Glances or Netdata are designed for minimal overhead. On a typical home server, a well-configured monitoring stack will barely make a dent, usually consuming just 1-5% of your CPU and memory. It’s a tiny price to pay for the peace of mind and insight you get.
Can I Monitor Individual Docker Containers?
Absolutely—and for any modern homelab, you really should. Monitoring individual containers is what separates the pros from the beginners. It lets you see exactly how much of your server’s resources each app—whether it's Home Assistant, Plex, or AdGuard—is actually eating up.
Most modern monitoring tools play nicely with Docker. You can use specialized "exporters" to pull detailed metrics from each container, giving you an incredibly detailed view of your entire software stack.
This level of detail is a complete game-changer. You can feed this container-specific data right into a tool like Dashable to create dedicated widgets for each service. Imagine seeing the real-time CPU usage of your Plex container right next to its status—it makes troubleshooting a walk in the park.
What Is the Difference Between Monitoring and Logging?
This one trips a lot of people up, but the distinction is pretty simple when you think about it. Monitoring is about numbers and trends; logging is about events and context.
- Monitoring is quantitative. It answers the question, "What is happening?" Think: "CPU usage just hit 90%."
- Logging is qualitative. It answers the question, "Why did it happen?" A log file might say: "Error: Database connection failed at 10:32 PM."
A truly solid setup uses both in tandem. Your monitoring system flags a sudden spike in CPU usage, and you immediately jump into the logs to find the exact process or error message that caused it. They’re two sides of the same coin, working together to give you the full story of your server's health.
Ready to turn those raw server metrics into a beautiful and functional command center? With Dashable, you can build the ultimate smart home dashboard, unifying your server health data with all your device controls. Start creating your perfect view today at https://dashable.app.


